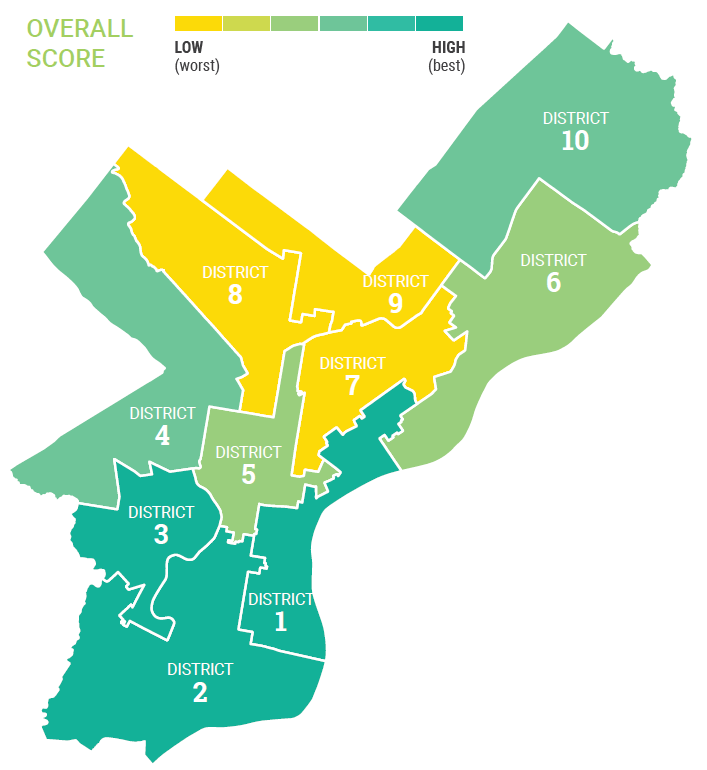
In this Data Analytics project, we mapped assets and risks to children’s health and well-being across Philadelphia and ranked city council districts from best to worst.
There are many maps of Philadelphia’s problems. In truth, we’ve even made some of those maps. They have a time and place – sometimes it’s important to point out where there are challenges and the audience might need to know where to target. However, to have a conversation about how to solve those problems, it might be a good idea to map assets and the positive factors that are also at play. For example, we have long known that Philadelphia has some of the highest rates of poverty, exposure to childhood trauma, unemployment, and low educational attainment. But, do we know what assets exist in Philadelphia and where we are working to strengthen them?
In our recent project with the Scattergood Foundation, we partnered to update their original Place Matters report — but also look at how Philadelphia’s neighborhood assets might mitigate the risks to children’s health and well-being. The previous version of the report produced scores for each zip code. We decided that reporting based on Philadelphia City Council district would be more apt to start a conversation with our City’s decision makers.
Our approach to this project was to do as much of the work using open data and open-source tools to the extent it was possible. We want this to be a framework that can be replicated as new data is released or with different asset or risk data. The data analysis process to produce the scores for each district is completely open and available on Github.
What are Philadelphia’s Risks and Assets?
We used the methodology from the original Place Matters report to calculate a risk score at the census tract level for all of Philadelphia. The data that was considered in that original report and updated for this version included:
- Crime – shooting victims per 10,000 people
- Education – percent of population 25 years and over with less than a 9th-grade education
- Poverty – percent of families in poverty
- Unemployment – the unemployment rate for the population 16 years and over
- Adverse Childhood Experiences – a study by the Public Health Management Corporation on indicators of traumatic stress
The assets we considered for this project were:
- SNAP utilization – using Census data, we calculated the percentage of households in poverty that are receiving benefits
- Behavioral Health Usage – behavioral health usage by zip code provided by Community Behavioral Health
- Walkable Access to Healthy Food – block level assessment of access to healthy grocery stores, from the City of Philadelphia
- Park Assets – we calculated a kernel density of parks and gave an extra bump to Rebuild sites, which will receive funding for rehabilitation
- School Performance – school performance scores from the School District of Philadelphia
For data that was only available at the zip code level, we used an area weighted join to disaggregate the value to the census tract. Then, the data for each asset and risk was converted into percentiles. We used percentiles as a way to compare the data against each other. Next, the percentiles for all census tracts falling within each council district were averaged to get a mean score for assets and risks for each district. Finally, the risk score was subtracted from the asset score to calculate the final cumulative score. This allows each district to be ranked against one another. For visualization in the report, we also calculated scores for each census tract.
Our technology stack was a combination of R and Python with the goal of having a reproducible data analysis, visualization, and report generation package.
Scoring Philadelphia’s City Council Districts by Assets and Risks
The final output is a series of reports tailored to each of Philadelphia’s 10 City Council districts. The report also contains an overall city summary and introduction to the project geared towards at-large council members. The maps and charts, all produced using R, are embedded directly into the report. The data used in the analysis and final calculated statistics for all council districts are included in the Github repository.

We found that Council Districts 7, 8 and 9 had the lowest cumulative score. District 7 is ranked lowest out of all ten districts and we also found that it has the highest percentage of children. However, it has the highest SNAP utilization and behavioral health utilization.

You can view the full Place Matters report here. Want to learn more about the project? Join the Scattergood Foundation’s Webinar on Thursday, April 18th at 2 pm ET. Learn more about the Data Analytics team.
