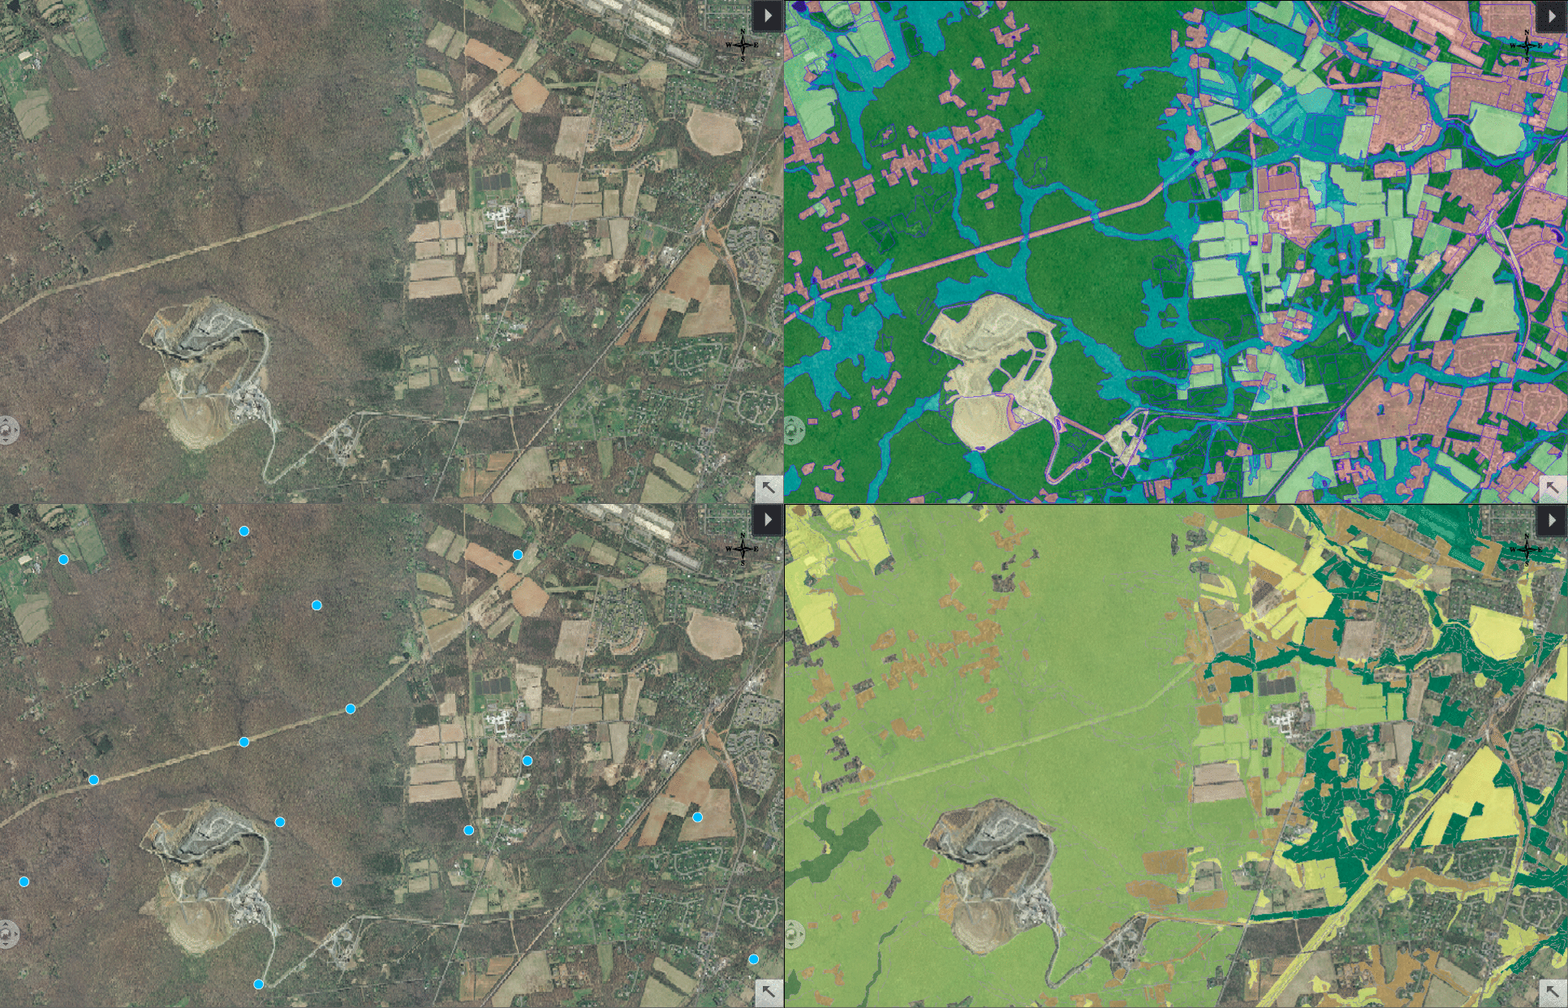
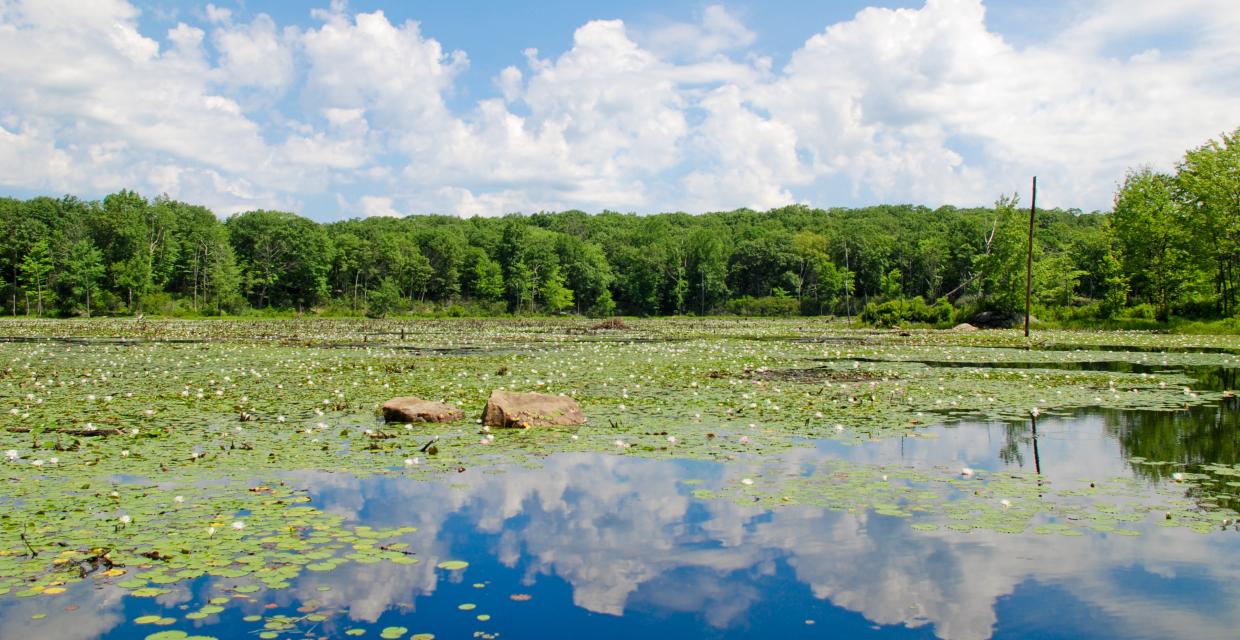
The New Jersey Department of Environmental Protection (NJDEP) maintains a statewide wildlife habitat data set that details conservation requirements related to environmental regulations. This is an open data set, but accessibility is limited since working with the one million habitat areas often requires knowledge of GIS software. Using desktop GIS software, a site-specific search is a time-intensive process, taking minutes or hours to run geoprocessing operations for specific properties.
Now, by leveraging advances in web-based mapping technology, a user can draw a custom area in a browser window and return results in seconds.

Try the tool: zoom to an area by typing an address into the search bar or by using the zoom navigation buttons. Then, draw a custom shape to display a list of wildlife habitat within the selected area.
To learn more about the technical process we used to convert a geodatabase to vector tiles for use on the web, read this post.
About the Data
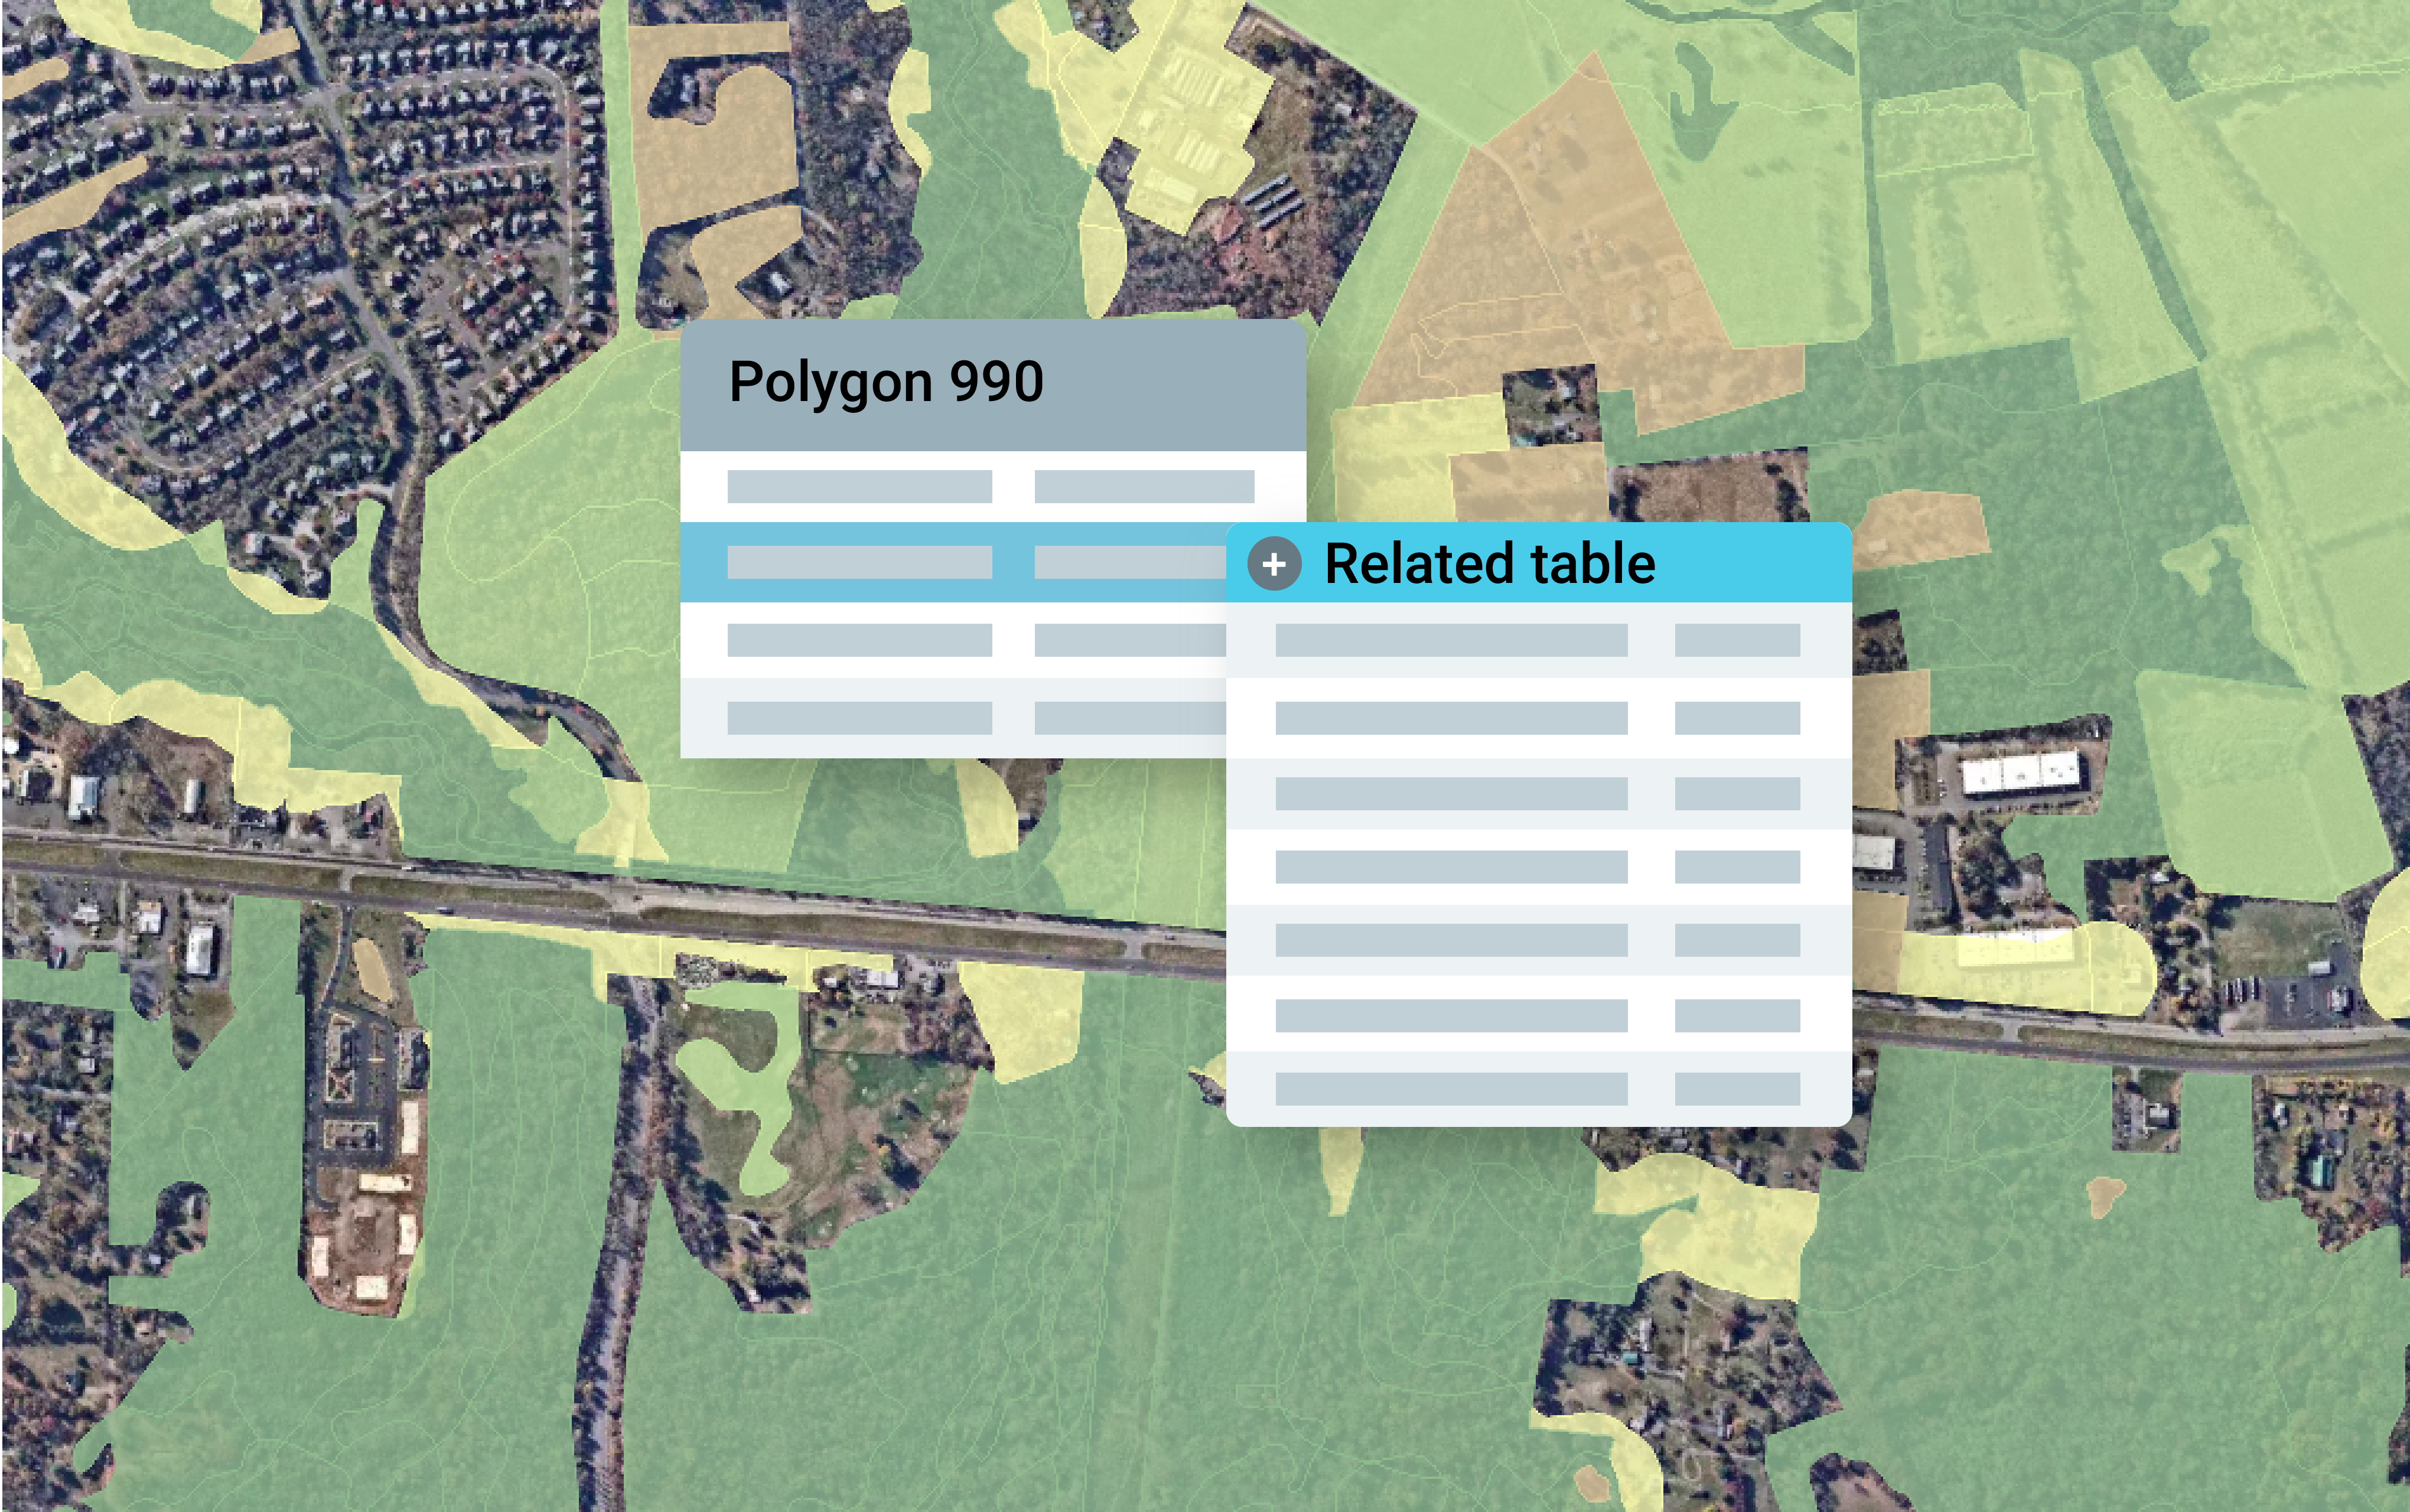
New Jersey Landscape Project is a database that combines imperiled and priority species location information with land-use/land-cover (LULC) data. The dataset is made up of hundreds of thousands of polygons with continuous, topological coverage for the entire state. Several related tables with rich attribute information about habitat type and wildlife sighting records are associated with the vector data.
Landscape Project wildlife habitat areas are determined by running species-specific models. NJDEP ENSP biologists create habitat models for each NJ Special Concern, Threatened, and Endangered species, including Federal Threatened and Endangered species.

The ENSP team uses a combination of species biology (i.e. movement patterns, habitat preferences, home ranges, etc), a crowd-sourced wildlife observation point dataset, and statewide LULC polygons to create potential habitat areas. View the story map produced by the NJDEP to learn more about Landscape Project 3.3 data.
Data sensitivities
One of the major goals of this dataset is to facilitate and encourage the protection of wildlife habitat. NJDEP biologists mask the locations of wildlife sightings by creating models that aggregate and dissolve land-use classifications into suitable habitat areas.
This is an important consideration when building a tool that makes data more accessible. The NJ Wildlife Habitat Finder application does not indicate the presence of wildlife on a property, but rather the presence or absence of suitable habitat as determined by the NJDEP.

This tool is intended to help people more efficiently comply with environmental regulations and identify areas for conservation, restoration, and mitigation efforts.
Desktop GIS process
For the most part, environmental consultants, regulators, and planners currently utilize desktop GIS software to analyze this wildlife habitat data. A typical workflow in desktop GIS software would include the following steps:
- download data
- create Area of Interest
- clip data to study area (for performance reasons)
- run intersection between Area of Interest and habitat data
- relate tabular data
- export list of wildlife habitat as data table
- remove duplicates
While this workflow is effective, it takes valuable time to complete this repetitive task. This process also requires a user to have experience using desktop GIS software.
Project goals
The general goal of the project was to apply Azavea 10% learning and research time for an impactful project that answered questions about specific technical processes.
We aimed to:
- Define a process for interacting with large vector data sets in a browser using open source libraries
- Test a method for appending related table data to vector tiles as JSON objects
- Create a Proof of Concept data processing workflow that can be applied to similar situations
- Design an application that allows a user to interact with the data in a browser
Why use this data?
The Landscape Project dataset was a perfect candidate for this project because it was provided as a file geodatabase with a large vector data set and related tables.

We also aimed to work with a dataset where there was potential for improving processes in an impactful industry. This stemmed from my experience working as an environmental consultant – I wanted to help relieve a pain point I have experienced working with this open data set.
Making open data accessible for good
Open data sets are invaluable resources. Open data powers civic tech applications, informs government decision-making, and can play an essential role in regulatory compliance.
In New Jersey, Landscape Project data drives land development and mitigation planning. The presence of wildlife habitat on a property determines what construction activities are allowed. It also helps to identify priority areas for conservation, restoration, and mitigation projects.
But even when data is made publicly available by government agencies, there can be significant barriers to entry.
The main results from this project were:
- Establishing a repeatable workflow for a common scenario across sectors: processing geodatabase files to vector tiles for access in web applications
- Providing a resource for planners and conservationists in New Jersey
What can you do?
This tool solves a specific set of problems – it’s an example of what’s possible if we apply the methods used in this project workflow to a similar need.
If you’re a landowner in New Jersey, use the NJ Wildlife Habitat Finder to get a list of wildlife habitat in your area. Then visit the US Fish and Wildlife Service Field Office website to learn about what you can do to protect or enhance habitat on your property.
Similar to much of our work, the source code is available under an open source license. Read the technical blog post about this project to learn how to convert geodatabase vector data with related tables for use on the web. Leverage the data processing pipeline on similar source data and let us know how it goes!
Does your team currently run repetitive processes in desktop GIS software, but can’t work with the source code yourself? The workflow used for this project can be applied to any geodatabase with related table information. Reach out to us to talk about your project.
