As a nonprofit, you do great advocacy and community work, but its often hard to find a way to stand out from the crowd. Funders, board members, and elected officials want to see the work you’ve done and the data to back it up. Data visualization and mapping can help with that!
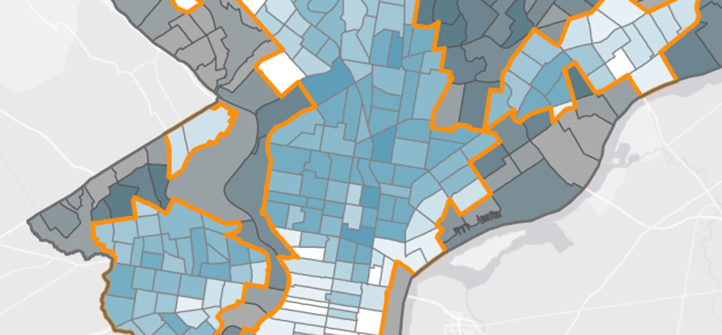
The Delaware Valley Association for the Education of Young Children (DVAEYC) modeled and mapped areas of high need for childcare with our team. By sharing these maps with local elected officials, DVAEYC was able to win $1 million from funders and local government for their advocacy work.
Join us for the first installment of our Map Readiness Webinar Series to learn how DVAEYC acquired and used data to win $1 million in funding – and how you can use data in your organization.
Even if you’re a brand new beginner, you can put data to work for your organization in a few simple steps, and we’ll be here to help you along the way.
First Webinar – Getting Open Data to Further Your Cause
- How DVAEYC won $1 million dollars
- Find open data
- Download spatial census data
- Collect your own data
- Prepare and format data
Getting Open Data to Further Your Cause
Wednesday, November 30th, 2016
2:00 PM – 3:00 PM EST
Upcoming Webinars in the Map Readiness Series
Second Webinar – Putting Your Data on the Map
- What is geospatial data
- Points, Lines, and Polygons
- Intro to CARTO, a free webmapping tool
- Intro to QGIS, a free desktop mapping tool
- Geocoding your data
Third Webinar – Your Data at Work with Data Analysis and Visualization
- Effective Cartography, Analysis, and Maps
- Infographics and data visualization
- Interactive visualizations
We’re really excited about data and we hope you are too! We look forward to seeing you for this webinar series!

