This post is part of a series of articles written by 2016 Summer of Maps Fellows. Azavea’s Summer of Maps Fellowship Program provides impactful pro bono spatial analysis for nonprofits, while fellows benefit from Azavea mentors’ expertise. To see more blog posts about Summer of Maps, click here.
In Philadelphia, about 100 people are killed in a traffic crash every year. Another 300 are involved in a crash with at least one reported major injury. Around 70 percent of severe crash victims are drivers, but pedestrians make up most of the rest.
Research has shown that road traffic crashes result from a combination of factors related to road components, such as vehicles and road users, as well as aspects of the environment. However, little work has been done on studying the spatial relationship between demographics and severe road crashes.
This summer, I have been working with the Bicycle Coalition of Greater Philadelphia to analyze the relationship between severe road crashes and demographics. The Bike Coalition is a non-profit advocacy group that has been actively involved with Vision Zero, a movement that seeks to reduce the number of traffic-related fatalities and serious injuries to zero.
One of the core principles of Vision Zero is that the street system should be safe for all communities and modes of transportation.
Regression Analysis
To test for any potential relationship, I conducted an Ordinary Least Squares Regression. This regression analysis allows you to model and examine spatial relationships to better understand the factors behind spatial patterns. In this case, the dependent variable (what you are trying to predict) was severe crashes and the independent variables were select population groups.
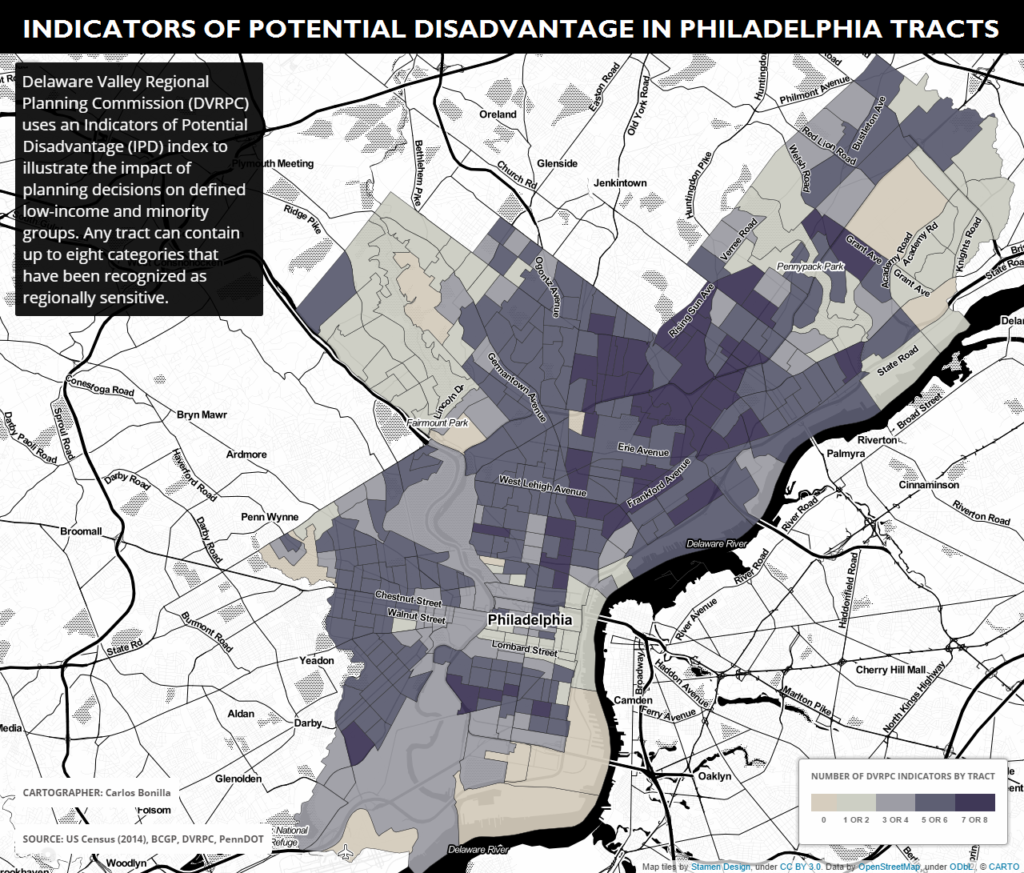
The demographic groups used in this analysis were based on the Delaware Valley Regional Planning Commission’s (DVRPC) Indicators of Potential Disadvantage (IPD). This tract-level index that utilizes the following population groups:
- Poverty
- Non-Hispanic Minority
- Hispanic
- Elderly (75+)
- Carless households
- Physically disabled
- Limited English Proficiency
- Female Head of Household with Child

The results of the spatial regression revealed that there is not much spatial relationship between severe crashes and IPD demographic groups. The best model could only account for about 10 percent of the variance (severe crashes). Generally, we are looking for values of 50 percent or higher.
Kernel Density Analysis
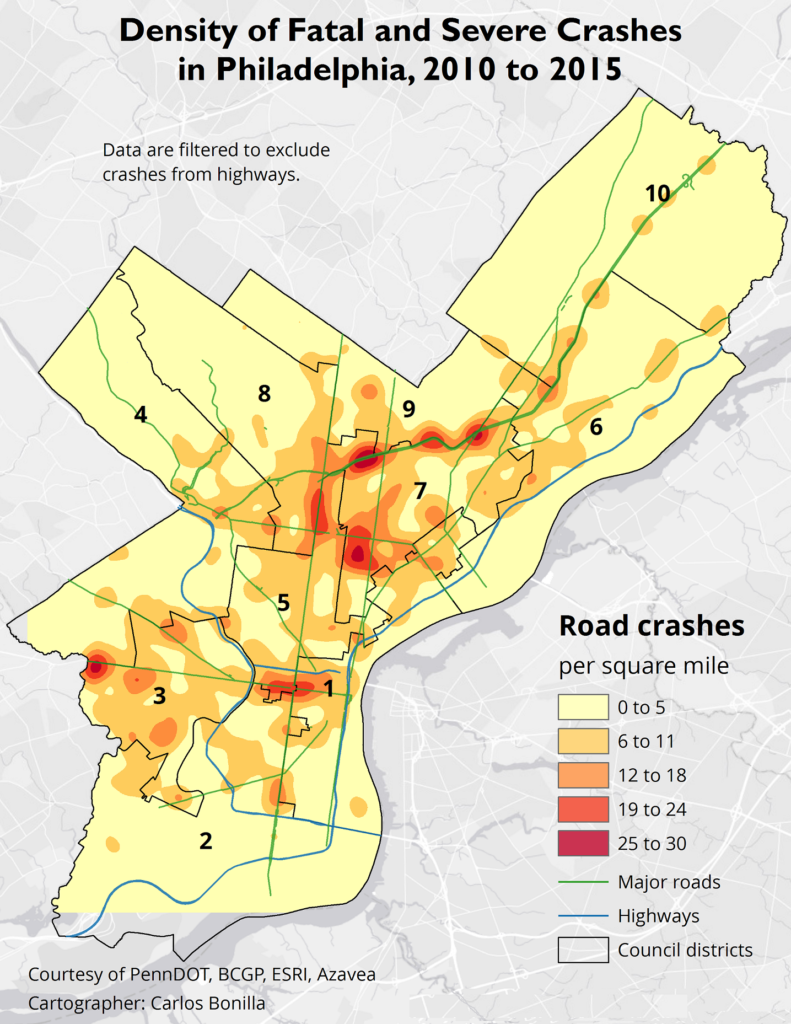
I conducted a kernel smoothing analysis to explore this relationship further. Kernel smoothing is a technique I used to create a series of “rings” around crashes to identify crash clusters. Each ring carries with a score that descends with distance from a point. The further a ring is from a crash, the lower the density score. If there are multiple crashes at a single point, the density score will be higher.
Crash density values taken from the kernel smoothing analysis were summarized into census tracts to compare with demographics. This analysis revealed a cluster of 8 tracts in North Philadelphia that had the highest overall crash density and higher than average values for poverty and carless households. The majority of crashes occurred along the Roosevelt Boulevard and Broad Street, major traffic arteries that run through North and Northeast Philadelphia.
The most interesting finding in this part of the analysis was a series of three tracts within this cluster.
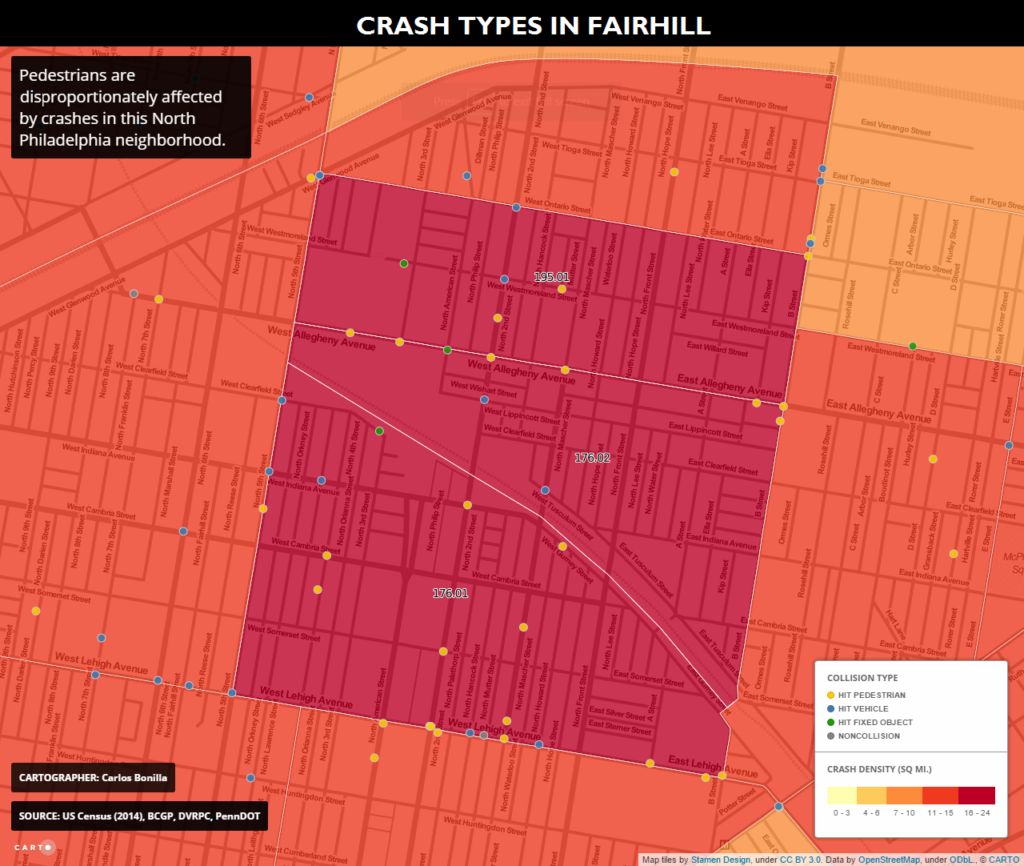
These three tracts belong to Fairhill, a neighborhood that is situated some distance away from the Roosevelt Boulevard and Broad Street. Compared to other neighborhoods in this cluster, there are fewer crashes overall (37). However, 20 of the crashes in this area involve a vehicle that hit a pedestrian. The majority of these pedestrian crashes occurred along Lehigh and Allegheny Avenues.

Even though the spatial regression failed to show any relationship, the kernel density analysis yielded more interesting results: crash density is highest in North Philadelphia, an area with higher than average poverty and carless residents.
Additionally, one neighborhood within this cluster has more than half of crashes that involve pedestrians. That’s about 4 times the citywide average. It’s not clear why crashes occur here so often, but nevertheless, this area needs special attention.
That is why it is crucial for organizations like the Bicycle Coalition to lobby for Vision Zero policy; they can use these findings to inform their future programming and advocate for safer streets for all.
Spatial analysis results in important findings
Are you involved with a non-profit organization that would like to analyze spatial data to address an issue? Summer of Maps fellows work with mentors each year to complete projects like the spatial analysis of crash data described above.
Keep an eye out for open application dates later this fall and reach out to us with questions about the Summer of Maps program!

