Storytelling with Odyssey.js
There were a lot of geospatial developments in 2014 (read about some of them right here). One of the more interesting additions to the web mapping scene was Odyssey.js, an open-source library created by CartoDB to enhance storytelling with maps.
I wanted to tell a short story about what our Summer of Maps fellows have been up to since they completed the program, as well as show where they made an impact by mapping the organizations they performed pro-bono work for during their tenure. The open-source Odyssey.js library and its super-simple Sandbox Editor made the work a snap. Let’s see how to make a simple but functional story map in Odyssey in just a few steps.
Choosing a Sandbox Template

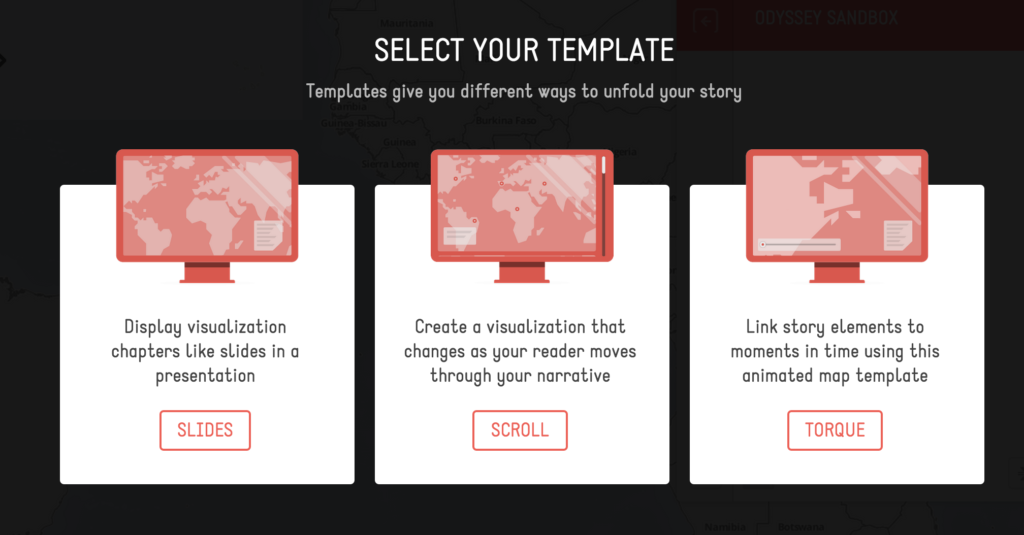
First, head to http://cartodb.github.io/odyssey.js/ and choose the “Create Story” button, which will take you to the Sandbox Editor. Once in the Sandbox select one of three templates. “Slides” (left in the image above) provides a very large map window with a small box to put small amounts of descriptive text. This template is appropriate for stories where sequential events aren’t very important. “Scroll” seems best suited to more in-depth stories, like full blogs or articles where the text at least as important as the map. Finally, the “Torque” template is similar to “Slides”, but includes CartoDB’s very cool Torque capability to visualize changes over time in point-based data.
Adding New Slides With Markdown
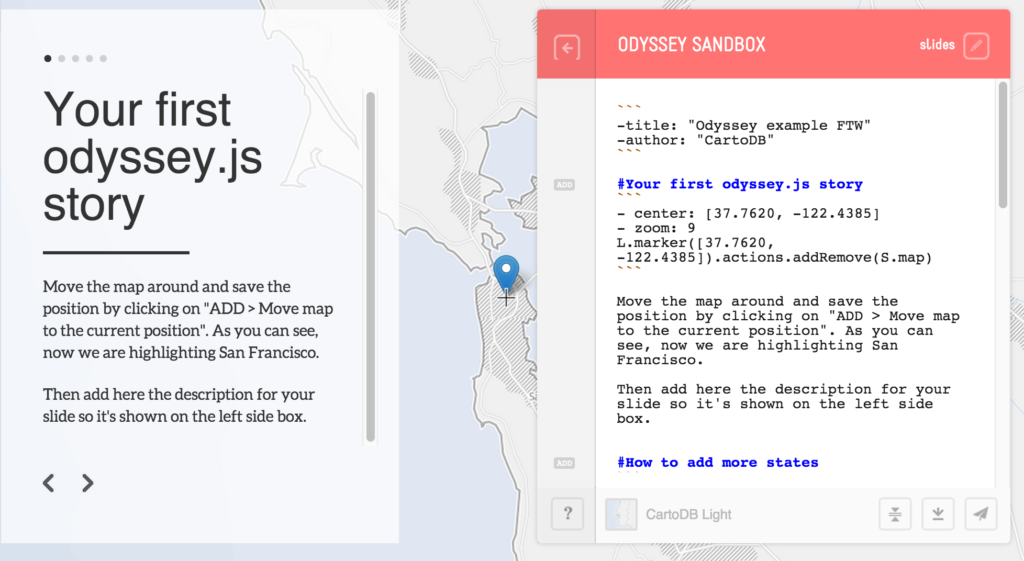
Once you’ve chosen a template, the Sandbox Editor comes pre-filled with boilerplate text and directions on how to format everything correctly. The editor itself uses Markdown formatting, and each new “slide” can be created with a simple “#” which is the highest heading level. New slides denoted by a “#” will have a small “add” icon that appears to the left of the text. Clicking will display options to drop a marker, tell the map to pan and zoom to a certain location, or “sleep”, which is used for Torque visualizations.

The Sandbox allows you to see how the changes you make affect the final product in real-time, so now is the time to add new slides, markers, and pans and zooms. It’s also entirely possible to save your progress in the editor by copying and pasting the Markdown text from the Sandbox into a text editor, saving it, and then pasting it in later over the boilerplate text when you’re ready to start up again (in fact, I would highly recommend doing this so you don’t lose progress). The rest of the important Sandbox functions are located on the bottom of the box. From left to right the buttons allow you to change the basemap, collapse the editor, download an HTML file, and share the results.
For our Summer of Maps Alumni story map, I added all the slides, markers, and movement through the Sandbox Editor. After creating the boilerplate storymap, I used the “Download Story” button to get the pre-filled HTML file. Downloading the HTML file allowed me to dig in and begin to customize beyond what the editor allows.
Out of the Box Customizations
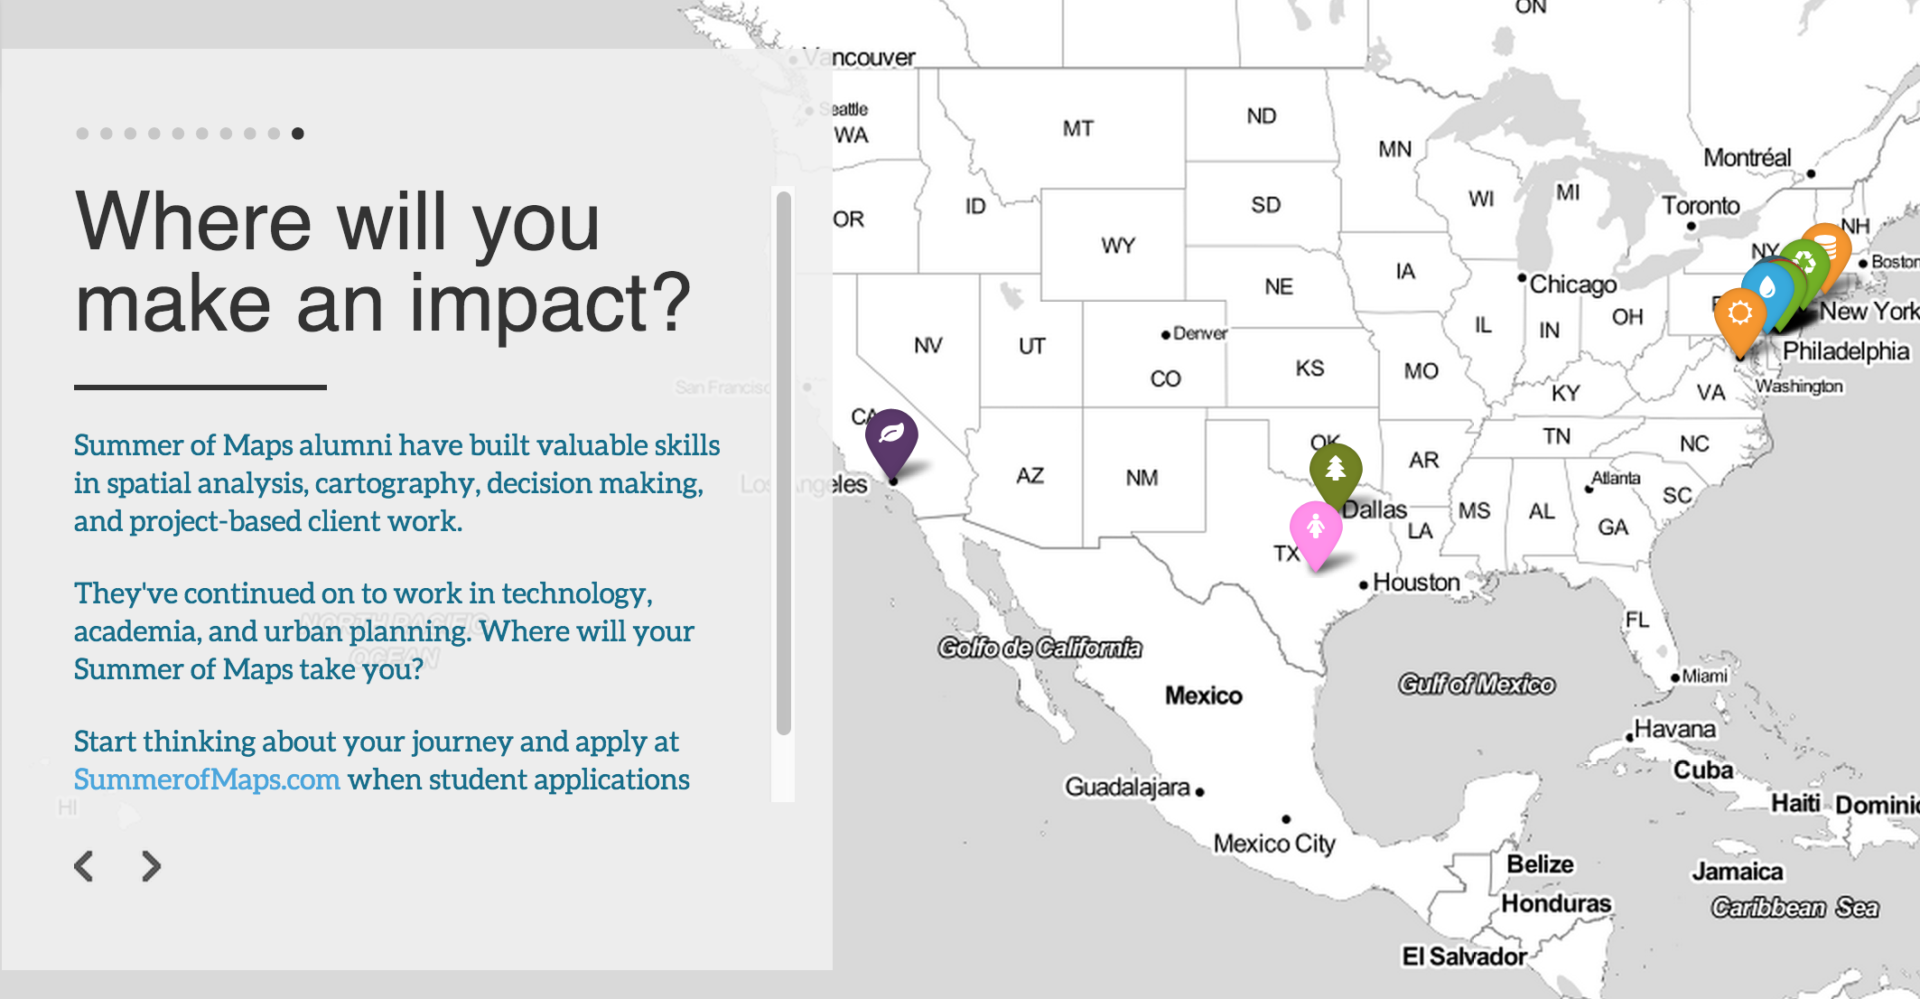
One of the first things I did was to change the basemap from the choices available in the Sandbox to the beautiful Stamen Toner Lite basemap. Next, I set about adding custom colors and icons to the markers using the Leaflet.Awesome-Markers plugin, which allows you to add custom vector icons from the free and beautiful FontAwesome and IonIcon libraries. For a more detailed tutorial on how to get custom Leaflet marker icons working check out ZevRoss.com’s excellent tutorial. Check out the custom markers in the screenshot below:

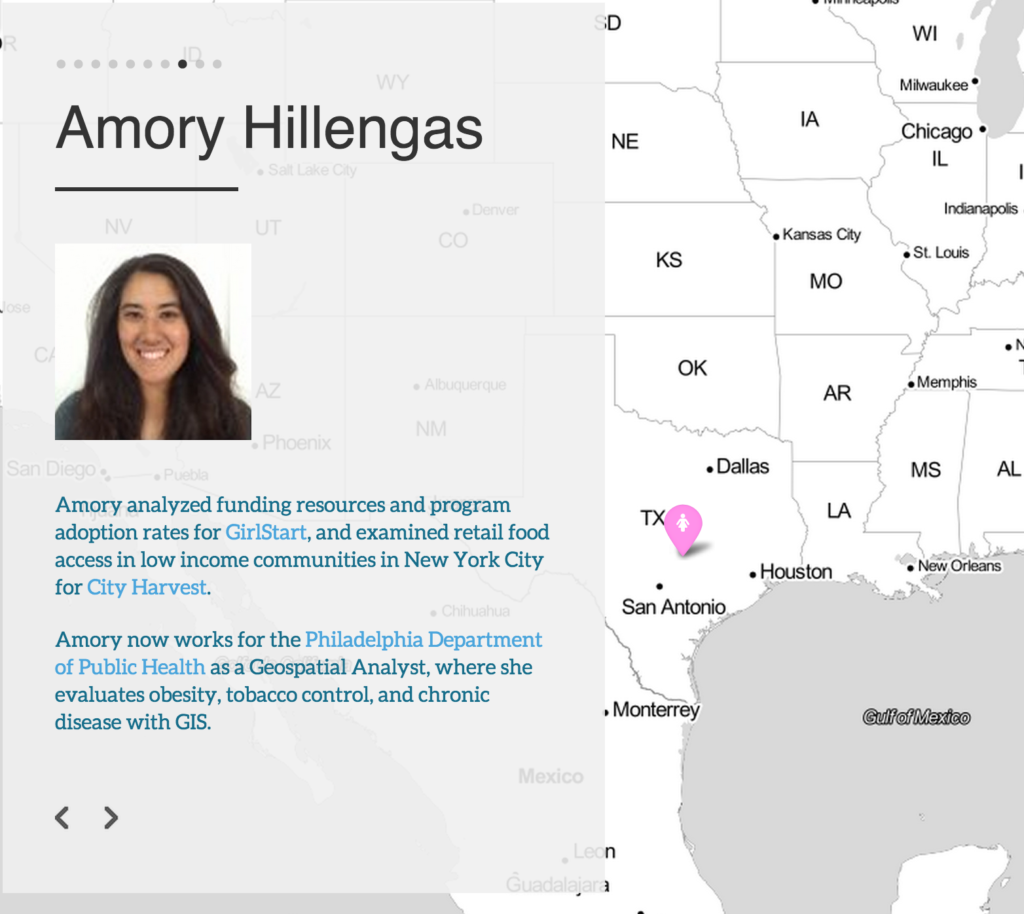
After customizing the markers, I wanted to tweak the text container a bit and the size of the photos. To do that I needed to change the CSS styling code. There are a few ways to go about this. One way is to clone the whole Odyssey.js repository to your computer using GitHub. I went another route and just downloaded Odyssey’s CSS file from the link that was referenced by the pre-made Sandbox Editor HTML file and copied the sections I wanted to change and pasted it into my code (forgive my sloppiness, I’m not a web developer). By tweaking the #slides_container CSS section I was able to adjust the opacity, width, and color of the slide text box, and by toying around with #slides_container.slide.scrolled img I was able to resize the headshots of the alumni.

Now that I’d gotten into the guts of the file and had taken it out of the Sandbox Editor, I could no longer use the built-in Odyssey.js Sandbox share function. Instead, I decided to use GitHub pages to host the file. Creating a free, dedicated website for websites on GitHub is dead simple, and they have an excellent starter page for setting up personal pages or pages to host projects (I made a project page). To check out the Summer of Maps Alumni story map using Odyssey.js, head to http://tdahlberg.github.io/summerofmaps or scroll down.
