Recently, to support Groundwork, we’ve needed to test the performance and reliability of our in-house Mapbox Vector Tile (MVT) service. Performance and reliability testing has a long and kind of fraught history at Azavea. We’ve relied on different tools at different times — some in house, some off-the-shelf, some cloud-based, some terminal-based. However, in the last half a year or so, we’ve started to standardize on using k6.io.
k6.io provides a flexible base for load testing with a convenient scripting language — I actually stole the base for this work from the Open Apparel Registry load tests and another project we’ve worked on. It was easy to configure the statistical output for the particular hypotheses I wanted to test with some brief JavaScript edits.
The quickstart docs there will get you Pretty Far™, but testing with a session of TMS requests had some unique challenges.
The k6 results layout
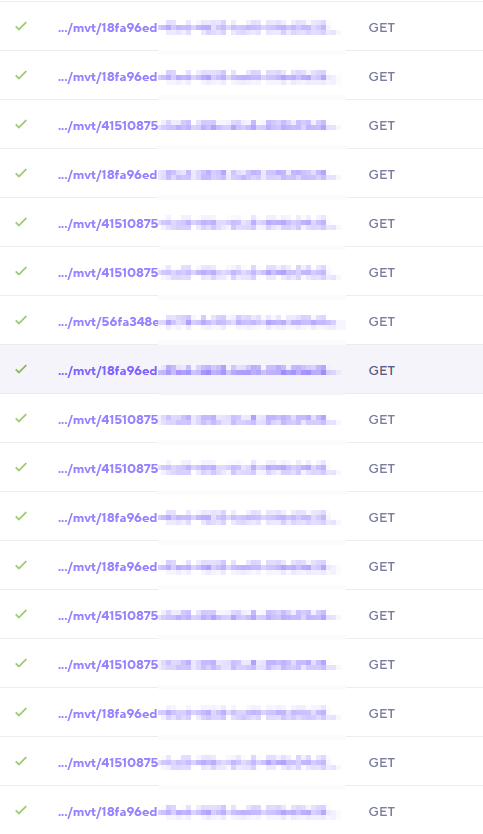
By default, k6 will show you a bunch of statistics grouped by URL.

If your session has more than 500 unique URLs, you get a warning from k6 about load testing best practices and a recommendation about grouping your URLs. For example, instead of reporting http://example.com/article/?id=1, http://example.com/article/?id=2, and http://example.com/article/?id=1 as separate URLs, k6 recommends grouping all of those requests under http://example.com/article using the tags: { name: ... } option for a test run.
This kind of grouping will increase the count of requests in each URL group and therefore will give you more reliable statistics.
TMS tile load tests
But what if you can’t throw away the id, for instance, if you have a hypothesis that the id has something to do with the server’s performance?
The story is actually slightly worse than that for our MVT service. Our MVT service responds to requests with the shape /mvt/project-id/mvt-request-type/z/x/y. mvt-request-type can be one of tasks or labels, project-id is a UUID, and z/x/y is a standard TMS triple. The x and y coordinates of the grid probably don’t have anything to do with server performance, but conceivably all of the other path components could affect it.
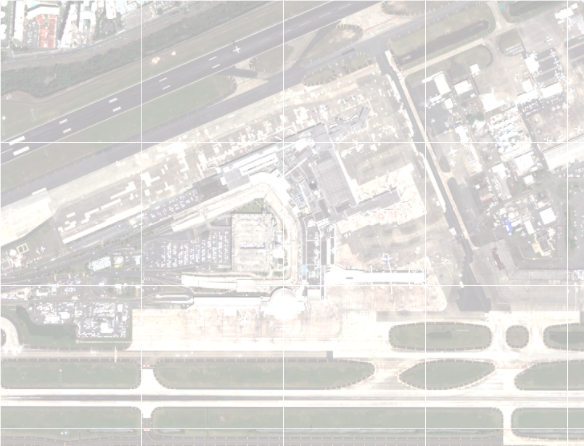
For example, our tasks MVT layer is a pretty simple collection of boxes:

But labels can contain many and sometimes quite complex geometries:

If we think that the type of MVT request, tasks or labels, has some bearing response statistics, we might want to separate by those instead.
Fortunately, k6 supports more or less arbitrary grouping. If we want URL grouping to respect the project IDs, MVT request type, and zoom, we can extract those from the URL and pass it to the tags: { name: ... } option.
// UUID regex shamelessly stolen from https://stackoverflow.com/a/13653180
const tagsRegex = new RegExp(
  /^.*\/mvt\/([0-9a-f]{8}-[0-9a-f]{4}-[0-5][0-9a-f]{3}-[089ab][0-9a-f]{3}-[0-9a-f]{12})\/(\w+).*$/
);
const [_, annotationProjectId, mvtRequestType] = baseUrl.match(tagsRegex);
const batchRequest = [
  entry.request.method,
  url,
  null,
  {
    tags: { name: ${annotationProjectId}-${mvtRequestType} },
  },
]
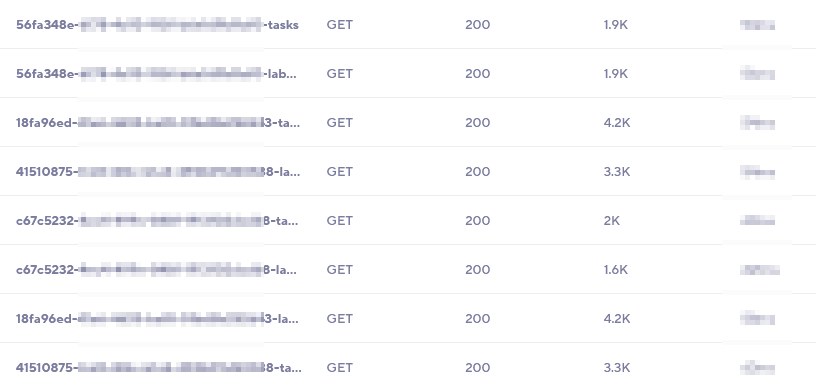
Grouping in this way gets us much clearer grouped statistics:

Also, because of the grouping, we get way more requests in each group. That gives us much more confidence in the request timing statistics, like the 95th and 99th percentile response times, since we’re drawing from thousands of requests instead of a few.
Having picked a load testing strategy that lets us test different hypotheses without much work, our future performance improvement work will be much easier.
