This blog describes the process for generating a Data URL or image file of the current map extent from a Mapbox GL Web Map that you can use elsewhere in your application or insert into a PDF document.

Why save the current map extent as an image?
Saving a web map extent as an image enables the use of static images in other areas of your application.
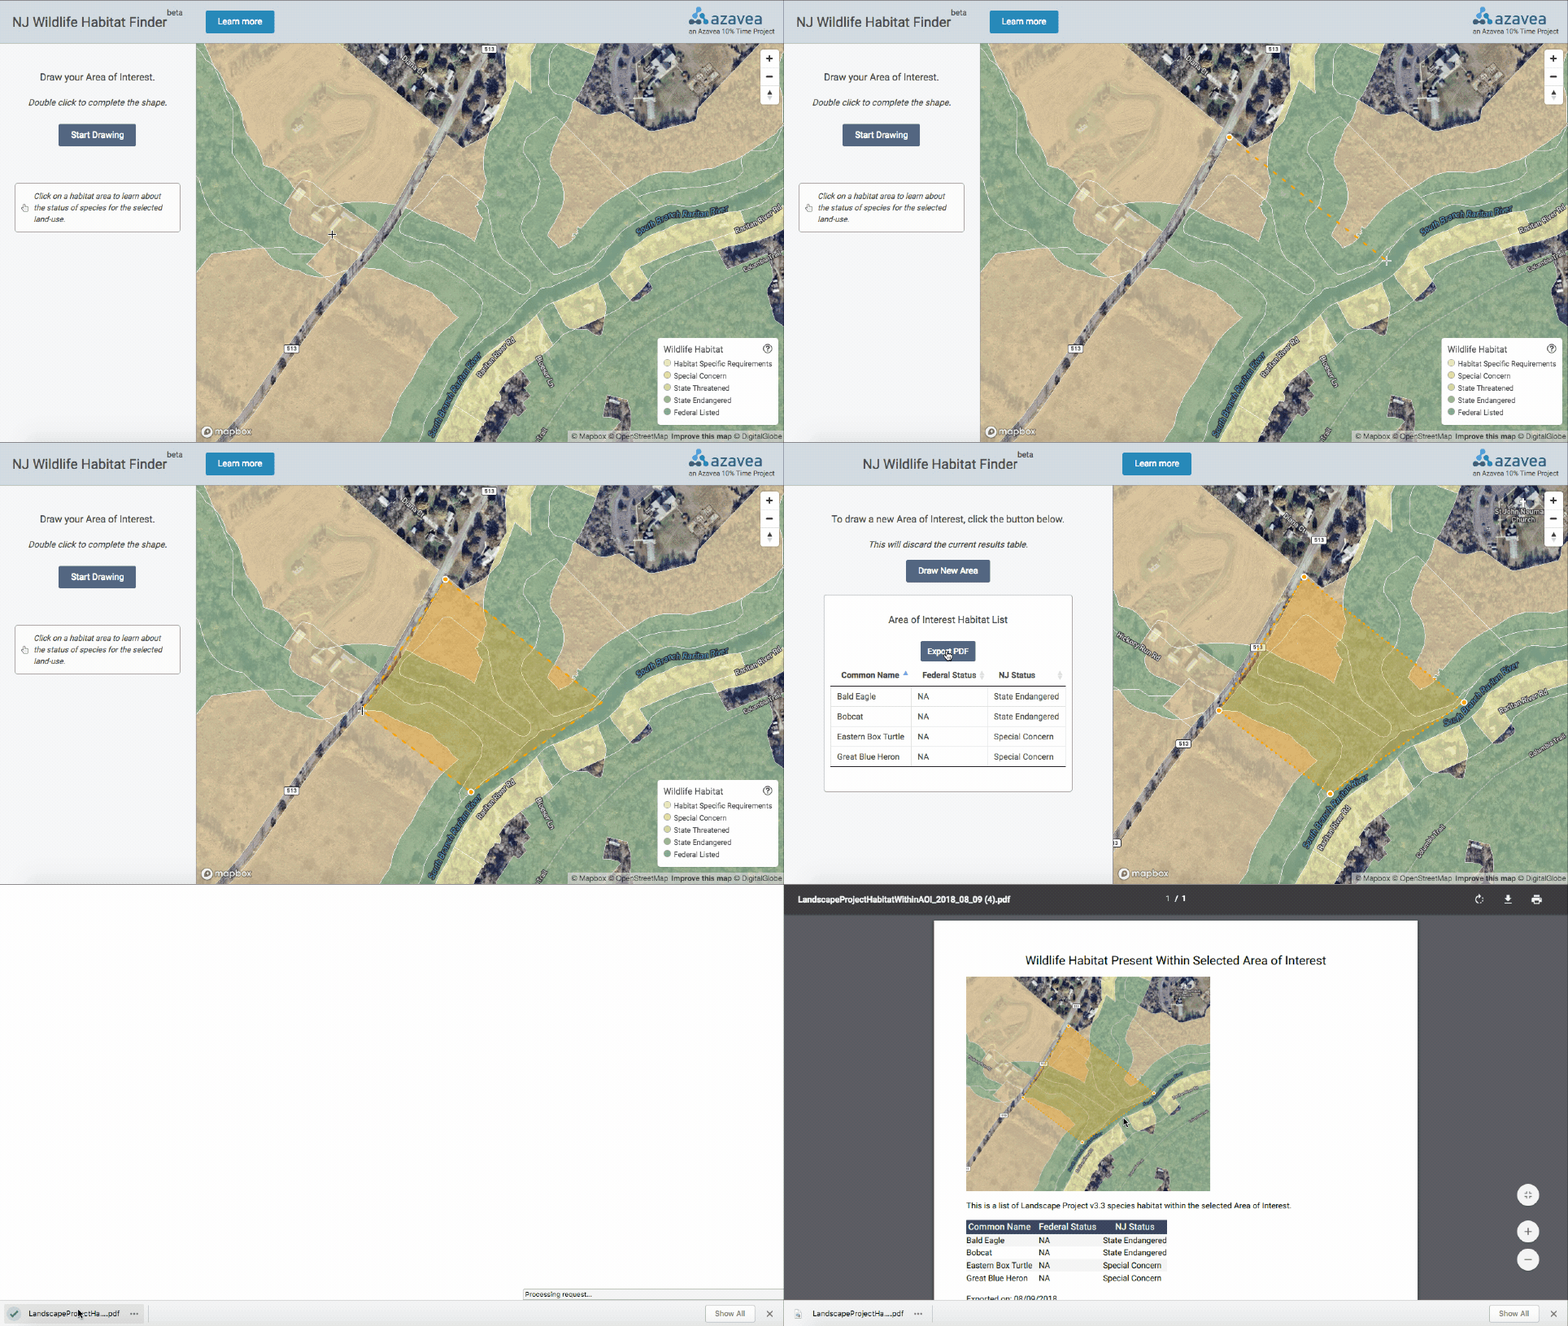
We recently defined an open source data processing pipeline for converting geodatabase files containing vector data and related tabular data into vector tiles for use in web applications. Then, we built a tool that enables a user to generate a list of wildlife habitat for an area of interest.
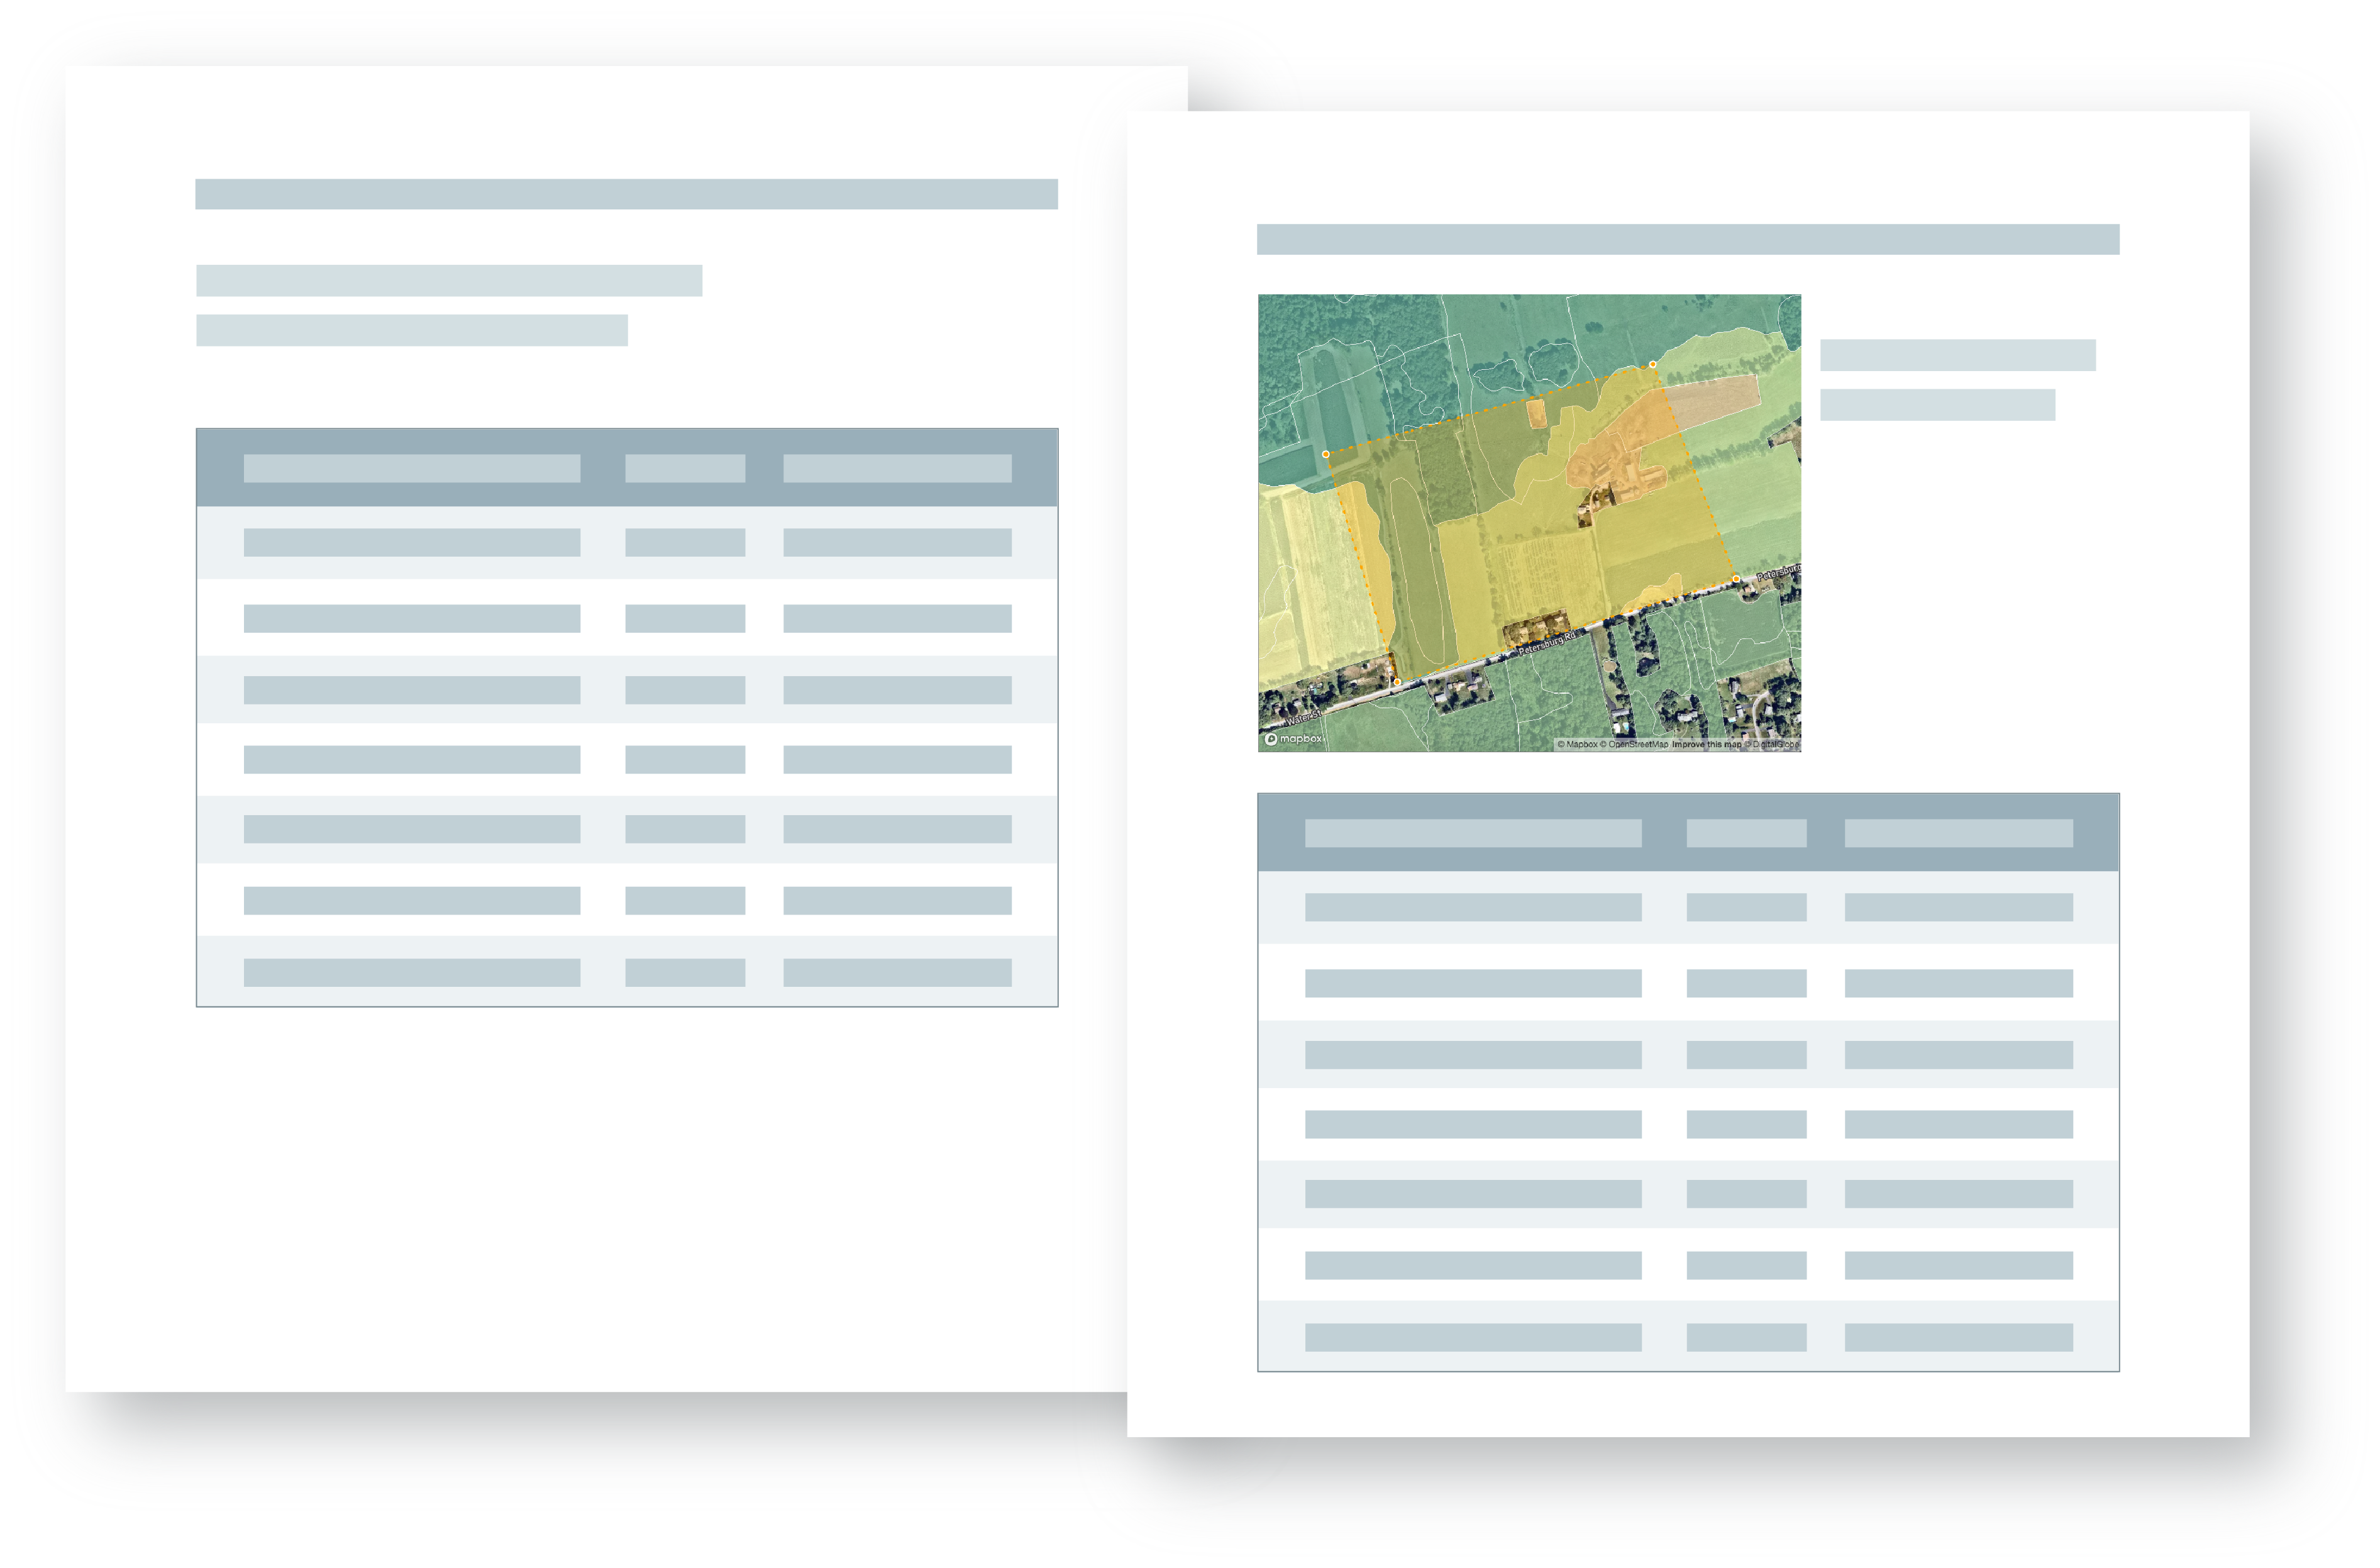
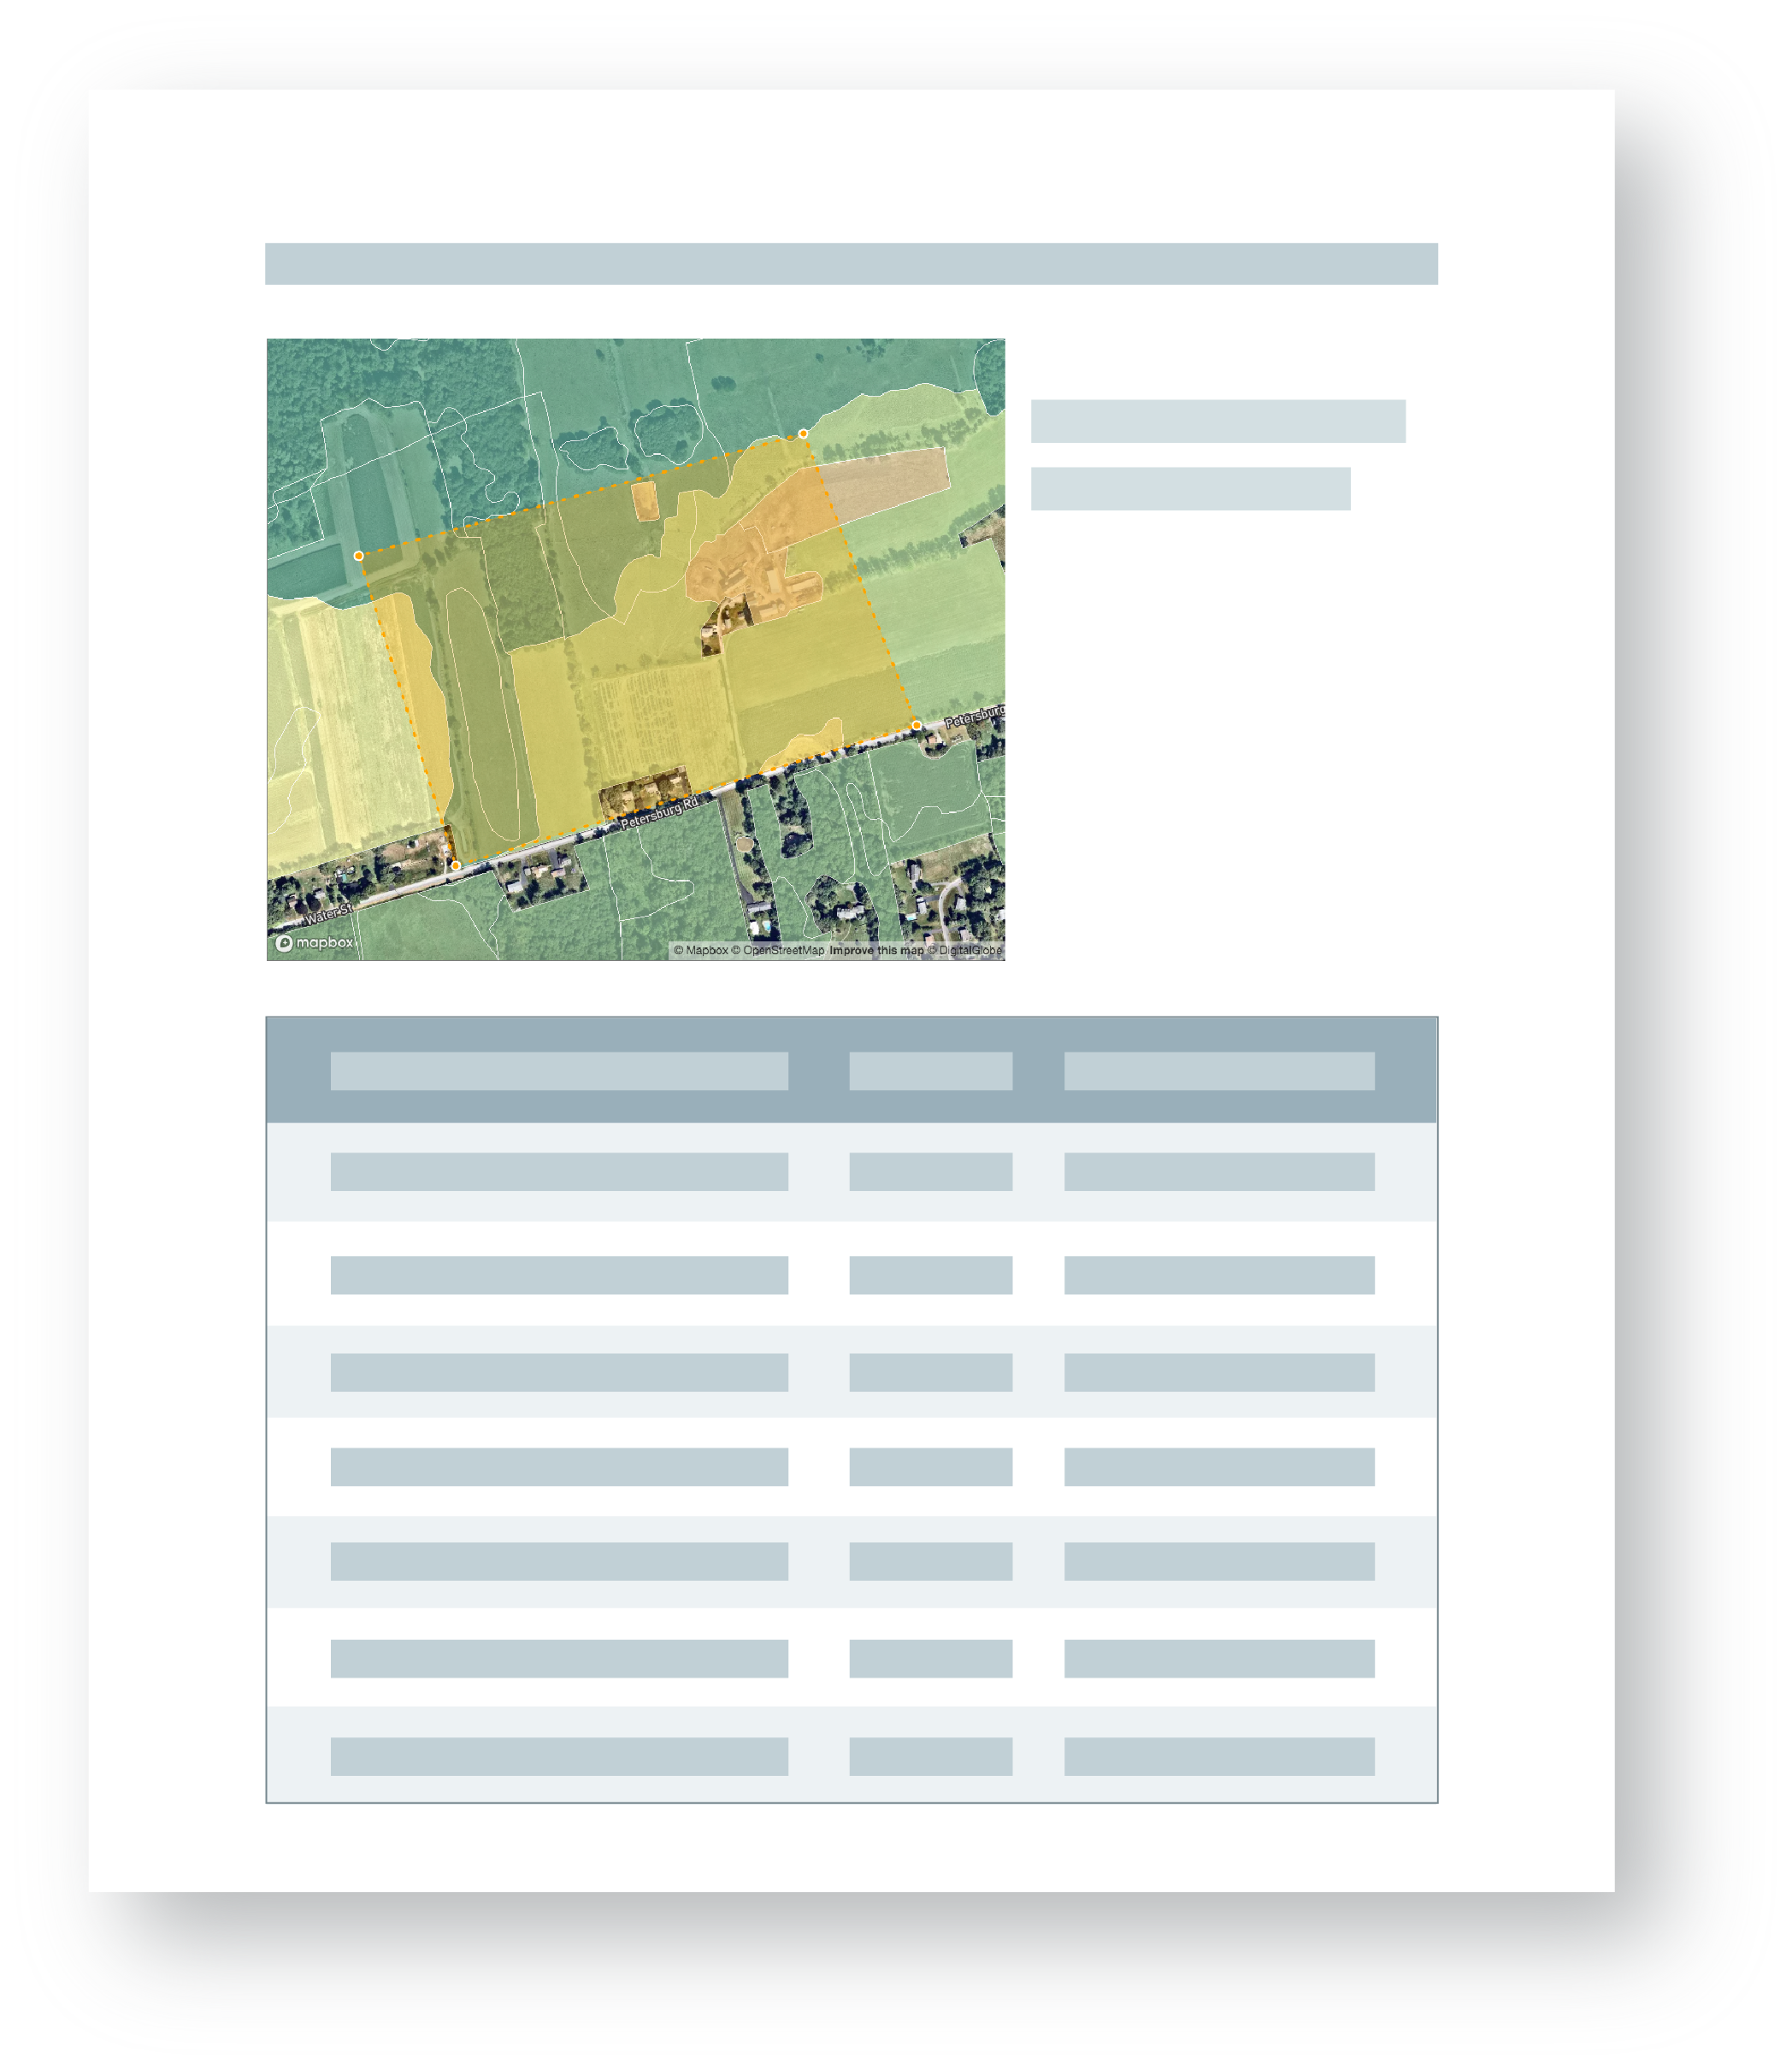
Based on a need in the community of users, we made the list available as a PDF download, in addition to displaying results in the application interface. The map image included in the downloadable PDF report provides helpful spatial context for the list of wildlife habitat.
Try the application to explore how we added an image of the current map extent to the results page.
The issue
In this example, a user draws a custom area of interest that does not necessarily coincide with a parcel or address. Without locational information like a parcel or address, we have limited options for providing the user with spatial context on the PDF export.

We could provide coordinates of the bounding box for the area of interest, but this wouldn’t be very helpful unless the user planned to look up the coordinates for each export.
The solution
To give the data results spatial context, we added an image of the current map extent and area of interest to the PDF export.
We considered using a variety of libraries to capture the current map extent. In the past, we have used window.print() and CSS print selectors to capture the current map extent and display it on a static output. We also looked into html2canvas and domtoimage, along with the Mapbox Static API.
For example, the Every Census Tract twitter account by Neil Freeman uses the Mapbox Static API to retrieve the imagery and ImageMagick to crop the images to each tract.
But, these methods require several lines of code or access to additional APIs.
Since Mapbox renders the Web GL map as a canvas element, you can set the current canvas extent as a variable, convert to a dataURL, and store the image to use elsewhere.
customize: function (doc) {
    var img = new Image();
    var mapCanvas = MAP.getCanvas(document.querySelector('.mapboxgl-canvas'));
    img.src = mapCanvas.toDataURL();
    doc.content.splice(1, 0,
        {
            margin: [0, 0, 0, 12],
            alignment: 'left',
            width: 300,
            image: img.src,
        },
    );
}
In this case, we were already using the jQuery DataTables plugin to render the wildlife habitat list in the sidebar and create a PDF download.
To insert the image of the current Mapbox Web GL map in the PDF, we nested the workflow as a function within the DataTables Button extension PDF -> customize property.

The final result is an image that you can use anywhere in your application.

Learn more about our work and sign up for our newsletter to stay in touch with the ways we’re applying geospatial technology and research for civic, social, and environmental impact.
