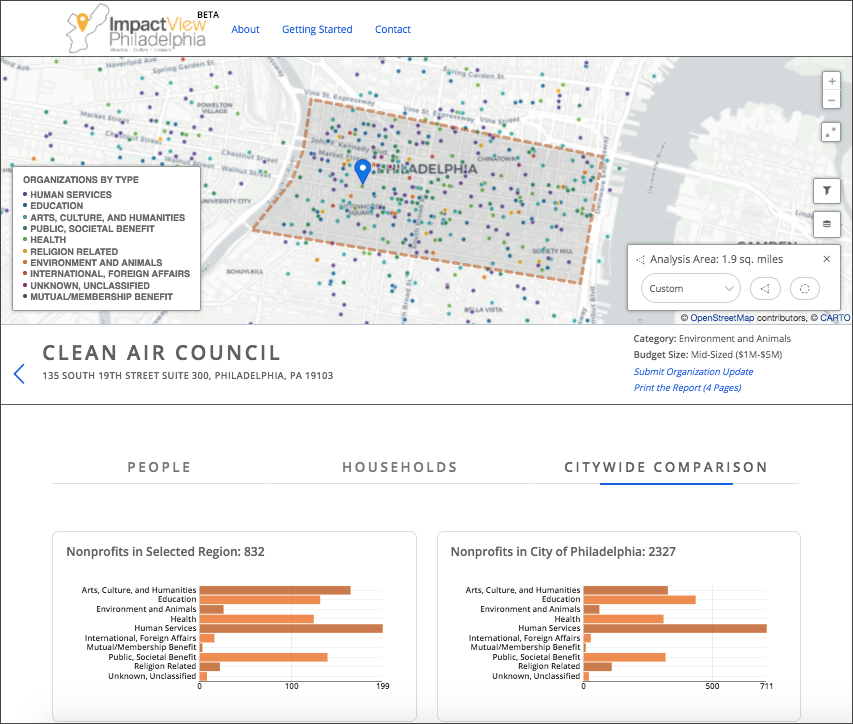
ImpactView Philadelphia is a web application that utilizes IRS nonprofit data and demographic information to enable custom analysis.
This open source tool includes a map view and interactive data visualizations that update based on a user-selected area. Display demographic data on the map like median income, poverty rate, percent children, or percent adults without high school diploma. Search for a location or nonprofit name and select a custom analysis buffer. Then view charts and graphs to visualize stats for the selected area.
Does your nonprofit have a specific service area? Draw a custom area for analysis and visualize the comparison between your office location and the communities you serve.
Read more about this tool in this article by Generocity.

